Whether you’re a graphic designer, a transport professional or just a frustrated commuter living in Brussels, you must have a look at the work of psychologist and cartographer Max Roberts. In the following interview, he tells us a few words about our transport system, which he believes has greatly improved, and teaches us a few things about map design …
British psychologist and cartographer Max Roberts (Essex University) is specialized in inductive and deductive reasoning, cognitive psychology and spatial reasoning and imagery. He is the author of this very simple and original Brussels tube map that I shared with you this morning. I asked him a few questions about his impressions on the Brussels transportation network and, most importantly, about his work as a cartographer …
EZ : I was surprised to hear that you know Brussels quite well. How come ?
MR : I first went to Brussels for a conference in 1999. I enjoyed the visit, and I am very fond of Art Nouveau architecture. Brussels is the best in the world for this, streets and streets of it in some parts of town. It’s a good city to walk in, and the people there are usually very friendly. The food is great.
EZ : What were your first impressions on the transportation network ?
MR : When I first visited Brussels, parts of the network were very run down. The stations on the north-south tram tunnel were quite deserted and frightening at night. Things are much improved now, and I always enjoy travelling on the metro and trams. I think that the signposting is very good, very clear, better in some ways than London and Paris, and trams have a great civilizing effect on a city. I always enjoy a trip to Tervuren, or the Atomium. It’s an under-rated network. The civil engineering work on the metro is very impressive too. I recommend a trip on the Brussels Metro on one day, and the Paris Metro the next day. The Paris network feels rather cramped and shabby in comparison.
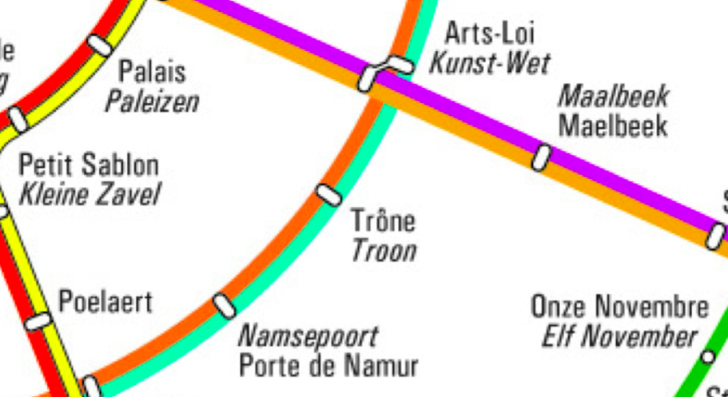
EZ : What do you think about this official Brussels tube map ?
MR : I am undecided about the new diagram, although the old geographical map was a bit scary. It’s a bit too much of a riot of colour. All those different stripes for the metro, tram, and bus routes makes the structure of the network hard to identify. I prefer the older maps from the early 2000s, all the bus routes in red, and all the tram routes in blue. I found that much easier to make sense of.
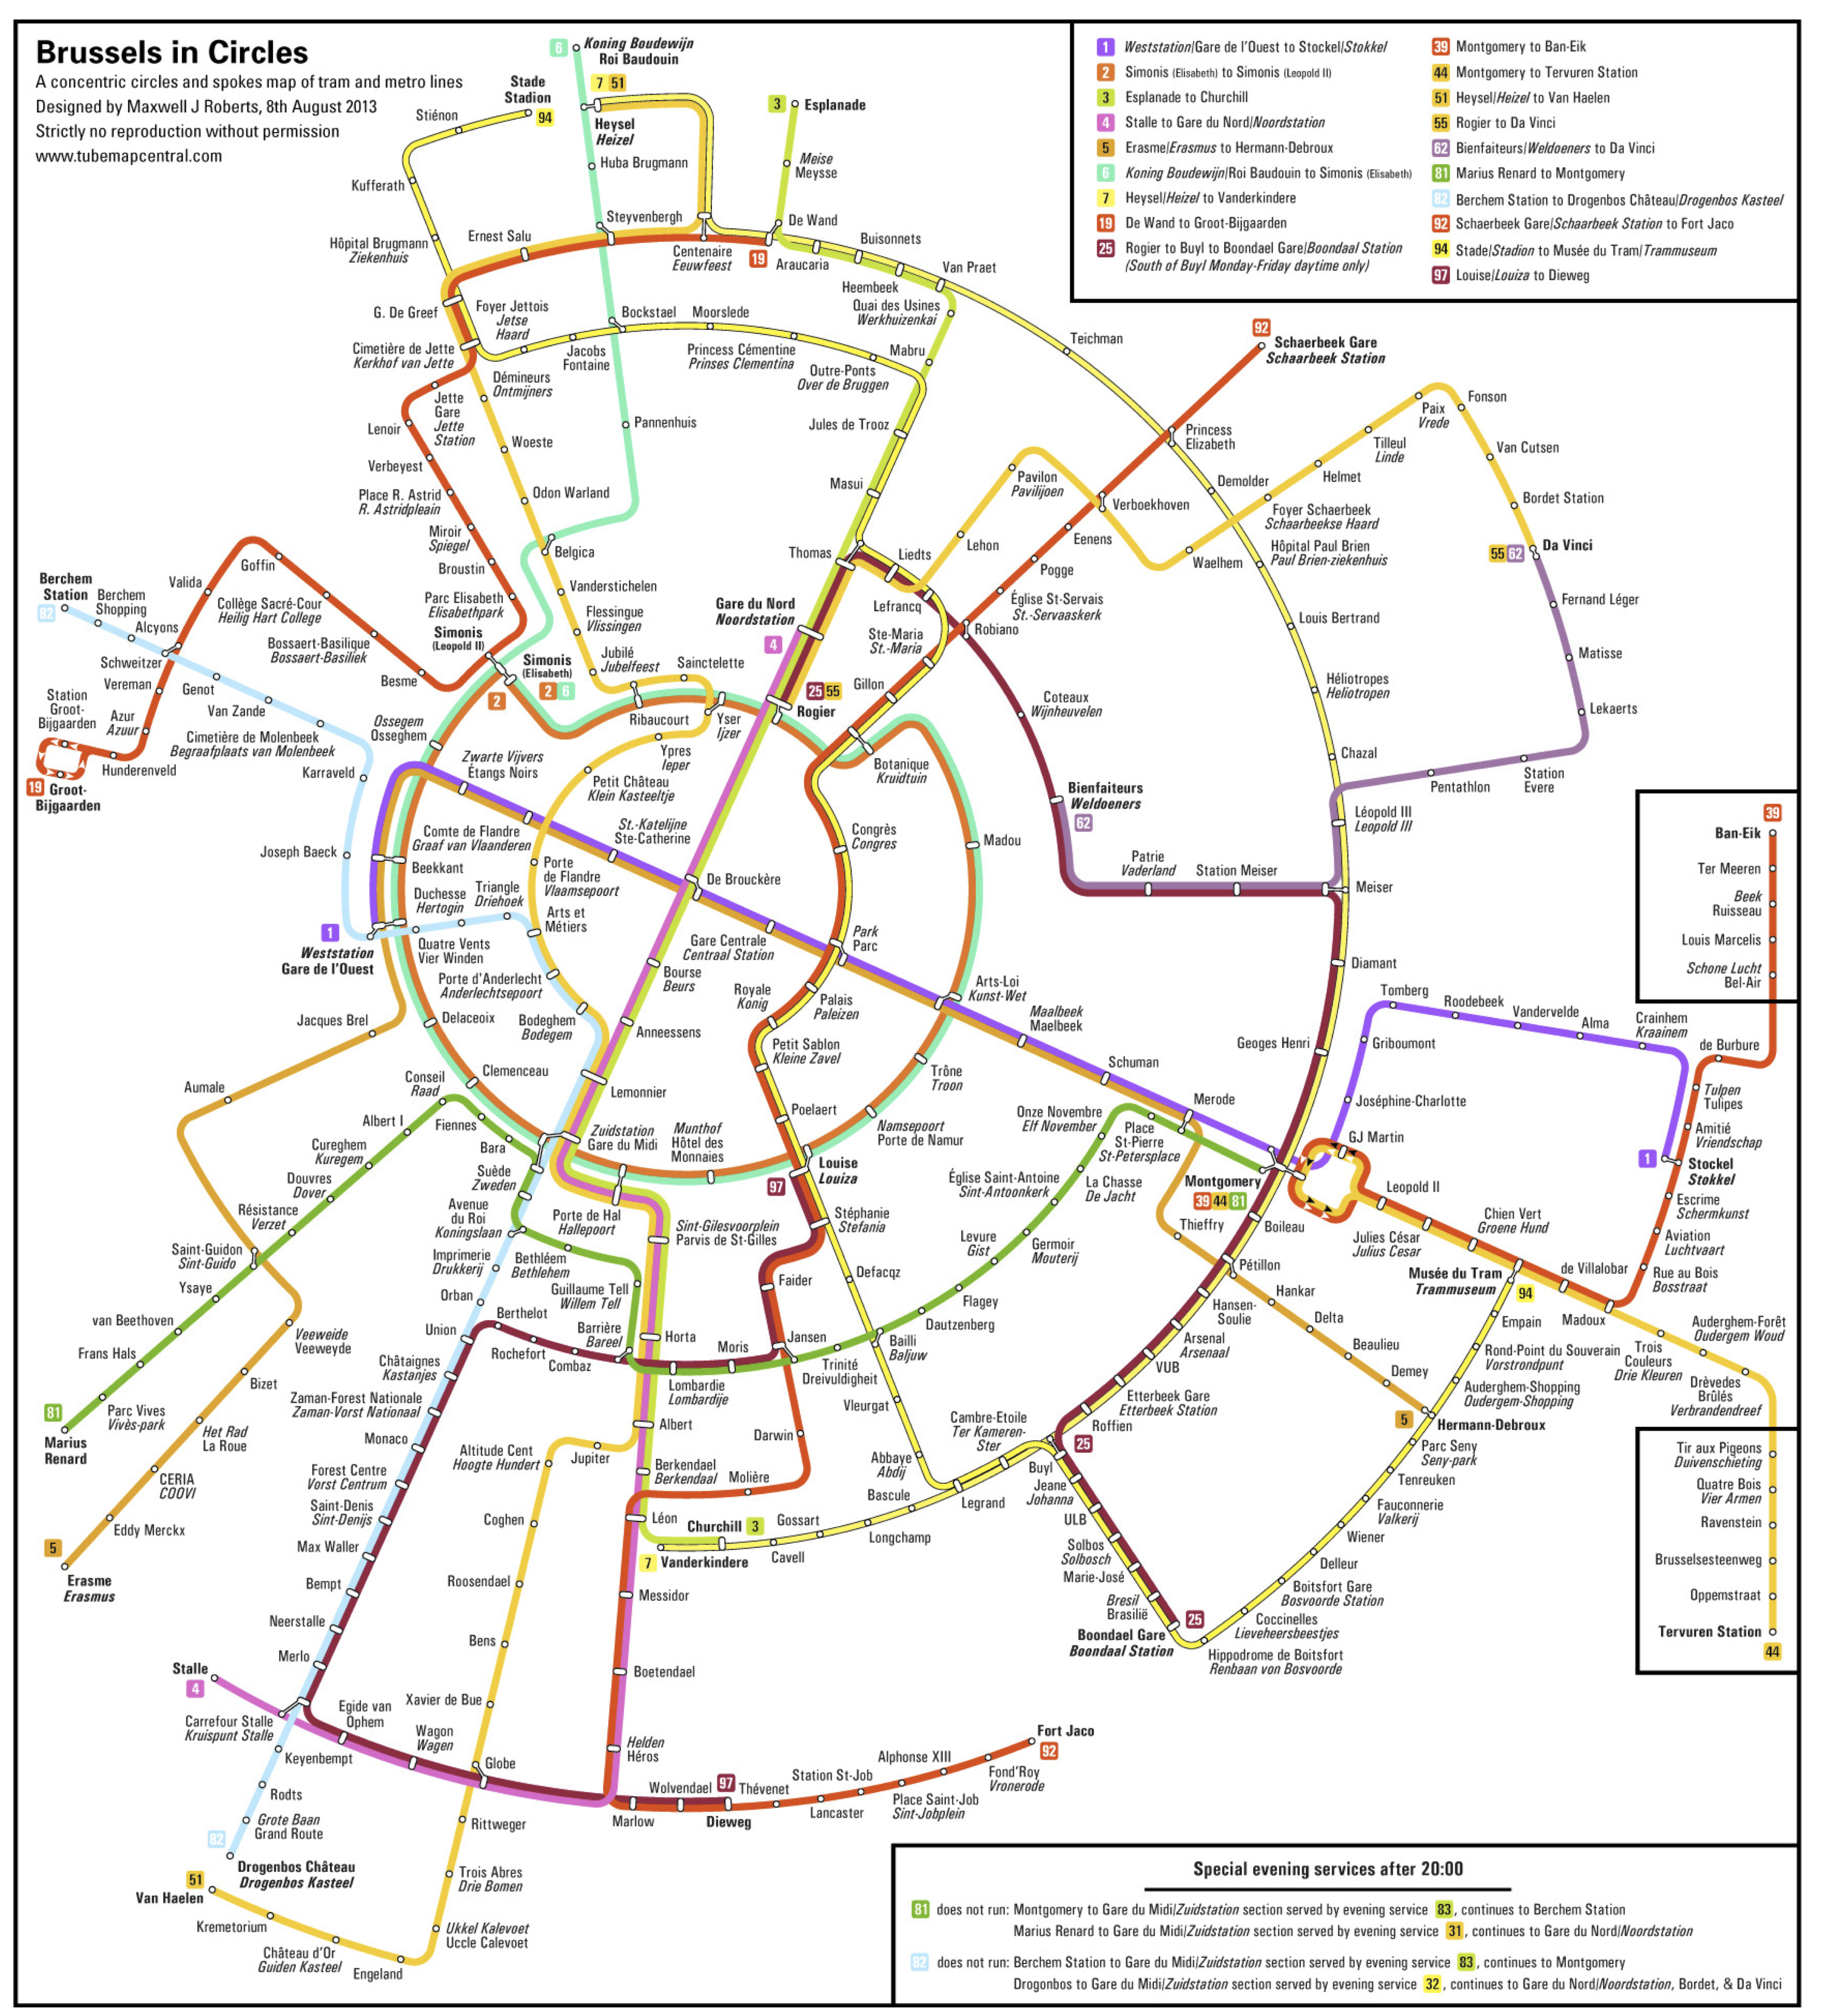
EZ : You designed a nice circular map of the metro and tram network. Can you briefly explain the method and tools that you used ?
MR : They are quite simple to design. You have to decide on the correct centre, easy for Brussels, harder for other cities, and then you build outwards, trying to keep the map as compact as possible, its like ripples spreading out on a pond. I’m a little bit sad that I couldn’t get a perfect circle for Metro Lines 2/6, this would have made the centre too large, but perhaps it looks like a silhouette of a cat’s head? I know the Brussels network well obviously, and the orbital tram routes were easy to fit around the map. Some very long stop names caused me a big problem, especially on Route 51. Overall, these maps are very constrained, so that once you decide on the basic features, the centre, and the major radial and orbital trunks, the map builds itself. I use a very basic vector package for the Mac, Intaglio. It is like Illustrator, but very light and fast. You don’t need advanced graphics features to create a map. Whatever package you choose, you just have to know it, and its strengths and weaknesses well.
_
Interviewed by Mathieu, 9 feb. 2015

Mat you are the best 🙂